Getting and Reading Data for Today's Class
Overview
Teaching: 20 min
Exercises: 5 minQuestions
How do I find and read in the data for today’s class?
What is an xarray.Dataset?
Objectives
Discern DataArrays from Datasets in xarray
Getting Started
- Launch a Jupyter notebook on Hopper. As a reminder, its best to launch it from your home directory, then you can get to any other directory from within your notebook.
- Be sure the environment is set to
clim_data. - Create a new notebook and save it as
Subsetting.ipynb. - Import the standard set of packages we use:
import xarray as xr
import numpy as np
import cartopy.crs as ccrs
import matplotlib.pyplot as plt
Find our Dataset
Today we will work with monthly Sea Surface Temperature (SST) data. We will use the monthly global OISST version 2 dataset:
* It is 1deg x 1deg
* Latitudes go from 89.5N to 89.5S
* It goes from Dec 1981 to Apr 2020
* It is currently located in the /home/lortizur/clim680/OISSTv2 directory
Now we will take a look at the data by opening a terminal session in JupyterLab (under the “File” tab) and looking in the directory where the data are located:
$ ls /home/lortizur/clim680/OISSTv2
lmask monthly weekly
Since we are looking for monthly data, let’s look in the monthly sub-directory. Remember, you can use the up-arrow to avoid having to re-type:
~~~
$ ls /home/lortizur/clim680/OISSTv2/monthly
~~~
sst.mnmean.nc
Quick look at Metadata for our Dataset
What command can you use to look at the metadata for our dataset?
Solution
ncks -M /home/lortizur/clim680/monthly/sst.mnmean.ncBut remember to load the NCO module first (if you have not already added it to your
.bashrcfile to load it automatically), so that you will have access to the commands in the NCO library:module load nco ncks -M /home/lortizur/clim680/OISSTv2/monthly/sst.mnmean.nc
We can now use cut and paste to put the file and directory information into our notebook and read our dataset using xarray
file = '/home/lortizur/clim680/OISSTv2/monthly/sst.mnmean.nc'
ds = xr.open_dataset(file)
ds
When we run our cells, we get output that looks exactly like the results from ncks -M
It tells us that we have an xarray.Dataset and gives us all the metadata associated with our data.
What is an xarray.Dataset?
In climate data analysis, we typically work with multidimensional data. By multidimensional data (also often called N-dimensional), we mean data with many independent dimensions or axes. For example, we might represent Earth’s surface temperature T as a three dimensional variable:
T(x,y,t)
where x is longitude, y is latitude, and t is time.
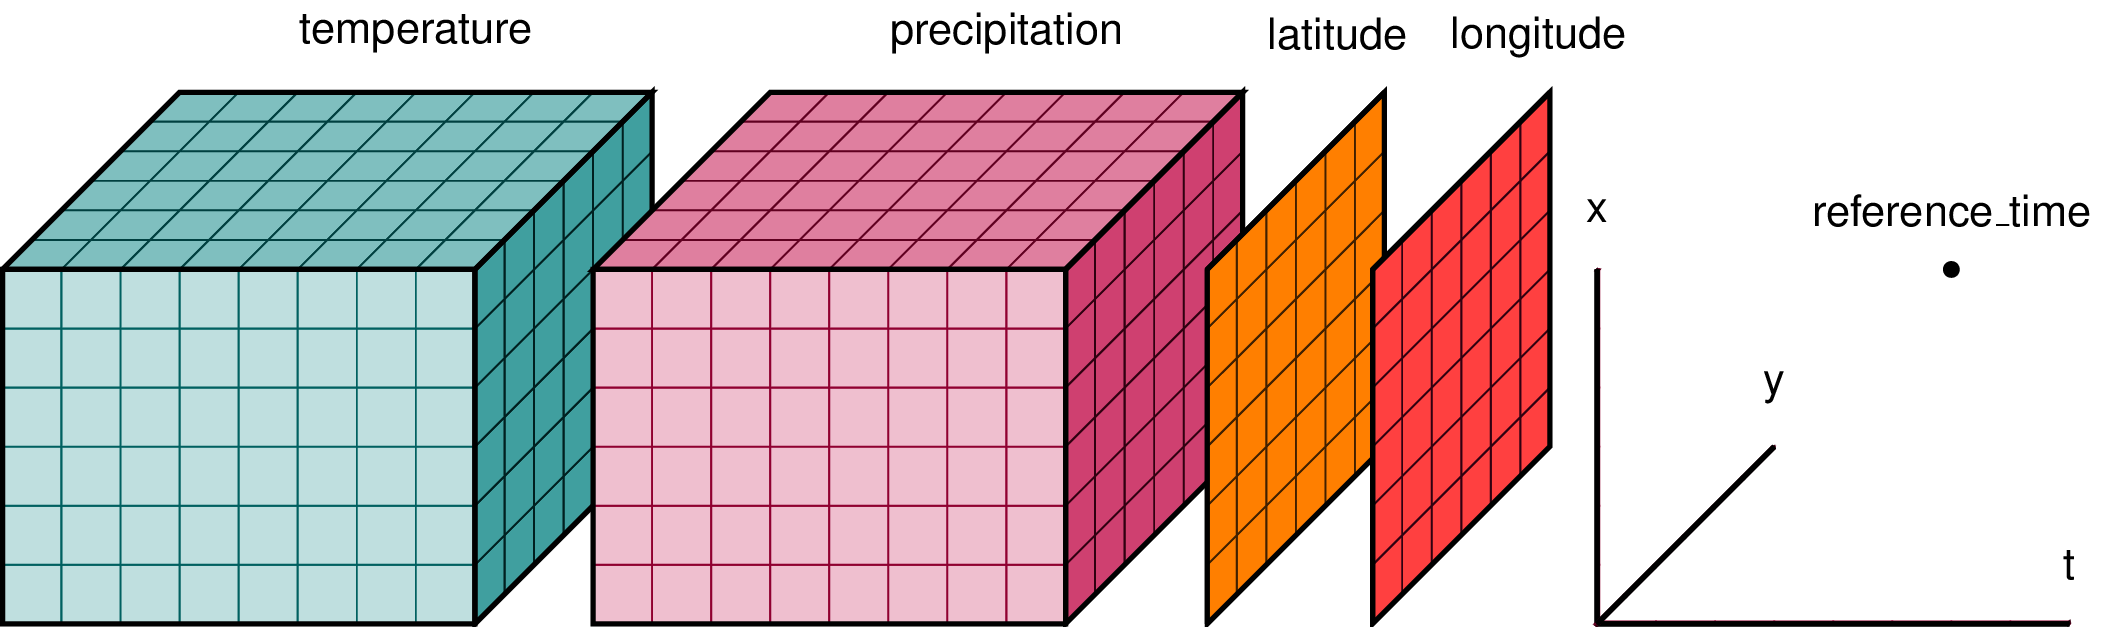
Xarray has two data structures:
* a DataArray, which holds a single multi-dimensional variable (or ‘grid’) and its coordinates
* a Dataset, which can hold multiple variables (DataArrays) that share some or all of the same coordinates
When we read in our data using xr.open_dataset, we read it in as an xr.Dataset object containing one or more DataArrays.
A DataArray contains:
* values: a numpy.ndarray holdy the array’s values (usually 1 or more dimensions)
* dims: dimension names for each axis (e.g. lon,lat,lev,time)
* coords: a container of arrays that label each point
* attrs: a container of arbitrary metadata
If we access an individual variable within an xarray.Dataset object, we have an xarray.DataArray object. Here’s an example:
ds['sst']
you will also see this syntax used
ds.sst
The latter is a little less flexible - it is harder to specify DataArray names as variables, and may fail if there are special characters in the name. The ds['sst'] construct is more robust.
Compare the output for the DataArray and the Dataset
We can access individual attribues attrs of our Dataset using the following syntax:
units = ds['sst'].attrs['units']
print(units)
Using
xarray.Dataset.attrsto label figuresGiven the following lines of code, how would you use
attrsto add units to the colorbar and a title to the map based on theunitsandlong_nameattributes?plt.contourf(ds['sst'][0,:,:]) plt.title(FILLINLONGNAMEHERE) plt.colorbar(label=FILLINUNITSHERE)
The xarray package provides many convenient functions and tools for working with N-dimensional datasets. We will learn some of them today.
Key Points
A Dataset may contain one or more DataArrays